REDCap_data
Analyzing data
Overview
If you use the repository to pull the data from REDCap, you will get an Excel file that looks something like this.

We can parse this file to organize the data in useful ways if we know the following.
record_idis a unique identifier for a mouse- There should be one, and only one row, for each
record_idwhere theredcap_repeat_instrumentis equal toNo data- This row contains information specific to that mouse, which never change, including its:
- date of birth
- sex
- genotype
- This row contains information specific to that mouse, which never change, including its:
- There should be one, and only one row, for each
- Most other
instrumentsin the database contain information about experiments, such as an echocardiogram.- These could be repeated (although they don’t have to be), so they have a
redcap_repeat_instance - You find all the echocardiograms for mouse XXX by searching your Excel file for rows where:
- record_id == XXX, and
- strcmp(redcap_repeat_instrument,’Echo’)==1
- These could be repeated (although they don’t have to be), so they have a
Recommended strategy
Most analysis tasks can be handled using the following strategy:
- Pull the latest data from the REDCap database and store it as an Excel file on your PC.
- do this using
pull_database_from_redcap.minrepo/code/pulling_data- by default, the Excel file will be stored in
repo/datausing a date-stamp as the file name
- by default, the Excel file will be stored in
- we will refer to this file as the raw_data
- do this using
- Load the raw_data as a table and parse it to create a simpler table that:
- contains only the information you want to analyze
- stores all the information relevant to each data point in a single row
- this nearly always involves collating data from multiple lines in the raw_data file using the record_id as a key
- note also that each instance of an instrument produces a data point, so if a mouse was subjected to 3 MRI scans, the data will appear in 3 separate rows
- this is also the step where you perform calculations using data from different instruments
- for example, the age of the mouse when it is scanned is calculated from the date the scan occurred (in the MRI instrument) and the date of birth for the mouse (stored as
mouse_date_of_birth) - similarly, the weight of a mouse when it was scanned is found by searching through the
weight_datevalues for the mouse and finding the one closest in time to themri_date
- for example, the age of the mouse when it is scanned is calculated from the date the scan occurred (in the MRI instrument) and the date of birth for the mouse (stored as
- Now write this simpler table to disk as an Excel file
- this format
- is easier to debug and troubleshoot
- can be fed into statistics programs (for example, R, or SAS - required for more complex tests like linear mixed models)
- can be used to create different types of figures using standard plotting tools
- this format
repo/code/analyzing_data contains several functions that may be helpful
create_mouse_table.m- creates an Excel file with summary information about each mouse including
- sex
- genotype
- date of birth
- status (alive / dead)
- death date
- creates an Excel file with summary information about each mouse including
create_weights_table.m- creates an Excel file with mouse weight data
create_mri_table.m- creates an Excel file with data relating to MRI experiments
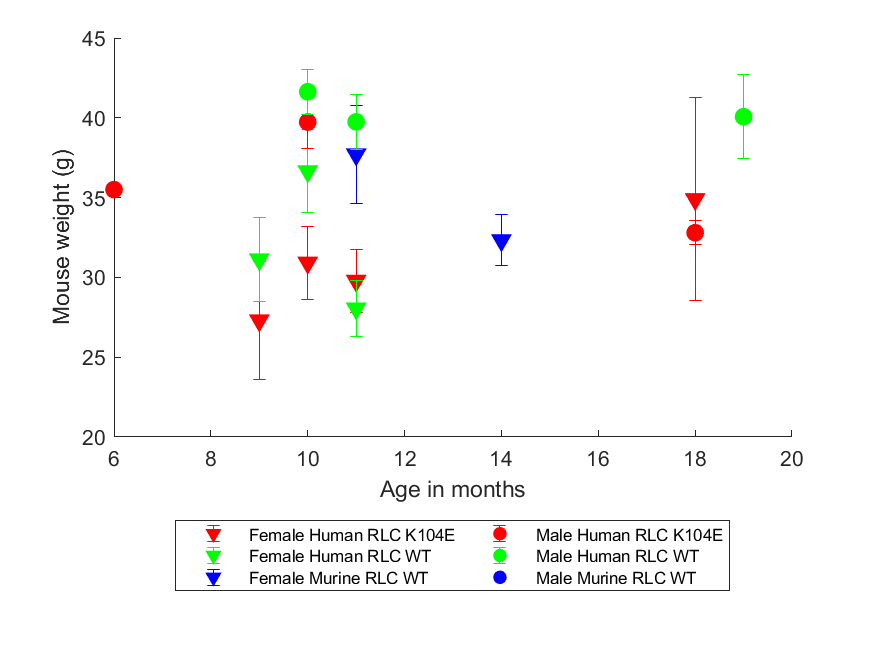
plot_field_by_age_as_mean_and_error.m- for each combination of sex and genotype, for a given data field (e.g. weight_mass_g), break ages into defined bins and plot as mean +/- standard error

- for each combination of sex and genotype, for a given data field (e.g. weight_mass_g), break ages into defined bins and plot as mean +/- standard error
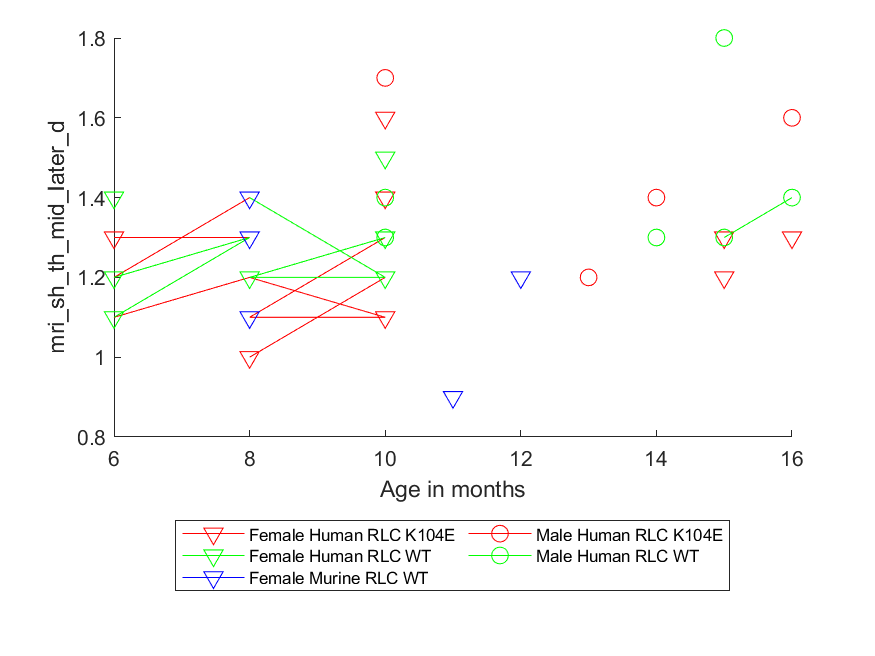
plot_field_by_age_as_linked_points.m- for each combination of sex and genotype, for a given data field (e.g. weight_mass_g), plot data for each specific mouse joined by straight lines

- for each combination of sex and genotype, for a given data field (e.g. weight_mass_g), plot data for each specific mouse joined by straight lines
Specific examples
These demos assume that you have added REDCap_data/code and sub-folders to your MATLAB path
- Planning
repo/demos/planning/planning_mri_experiments.m- calls
create_mri_table.mto create an Excel file containing the parsed data- loads the mri data file as a table
- deletes fields not required for experiment planning purposes
- saves the table as a new, simpler Excel sheet called
scan_dates
- calls
create_mouse_table.mto create an Excel file containing summary data about every mouse in REDCap- loads the mouse data up as a table
- merges mri scan dates into that table to show which mice:
- have had MRI scans
- at which dates
- saves that table in two Excel sheets:
summary- which has a table showing number of scans at each agescan_ages- which includes columns forscan_n_date(where n = 1 to ?) andage_at_scan_n_in_months
- calls
- Analyze animal weights
repo/demos/example_weights/weight_analysis.m- calls
create_weight_table.mto create an Excel file containing the parsed data - calls
plot_field_by_age_as_mean_and_error.mplot_field_by_age_as_linked_points.mto create image files
- calls
- Analyze mri data
repo/demos/example_mri/demo_mri_analysis.m- calls
create_mri_table.mto create an Excel file containing the parsed data - then loops through all appropriate mri data fields
- calling
plot_field_by_age_as_mean_and_error.mplot_field_by_age_as_linked_points.mto create image files
- calling
- calls
repo/demos/example_mri/demo_mri_analysis_with_weight_normalization.m- calls
create_mri_table.mto create an Excel file containing the MRI data - calls
create_weight_table.mto create an Excel file containing the weight data - then loops through all the MRI scans looking for scans where the mouse was weighed within x days
- normalizes MRI data to weight as described in A novel method optimizing the normalization of cardiac parameters in small animal models: the importance of dimensional indexing
- writes the data to Excel
- then loops through fields calling
plot_field_by_age_as_mean_and_error.mplot_field_by_age_as_linked_points.mto create image files
- calls